Plant Manager Dashboard
The Plant Manager dashboard provides an at-a-glance view of production and performance metrics. It is a valuable tool for improving production efficiency, quality, and communication.
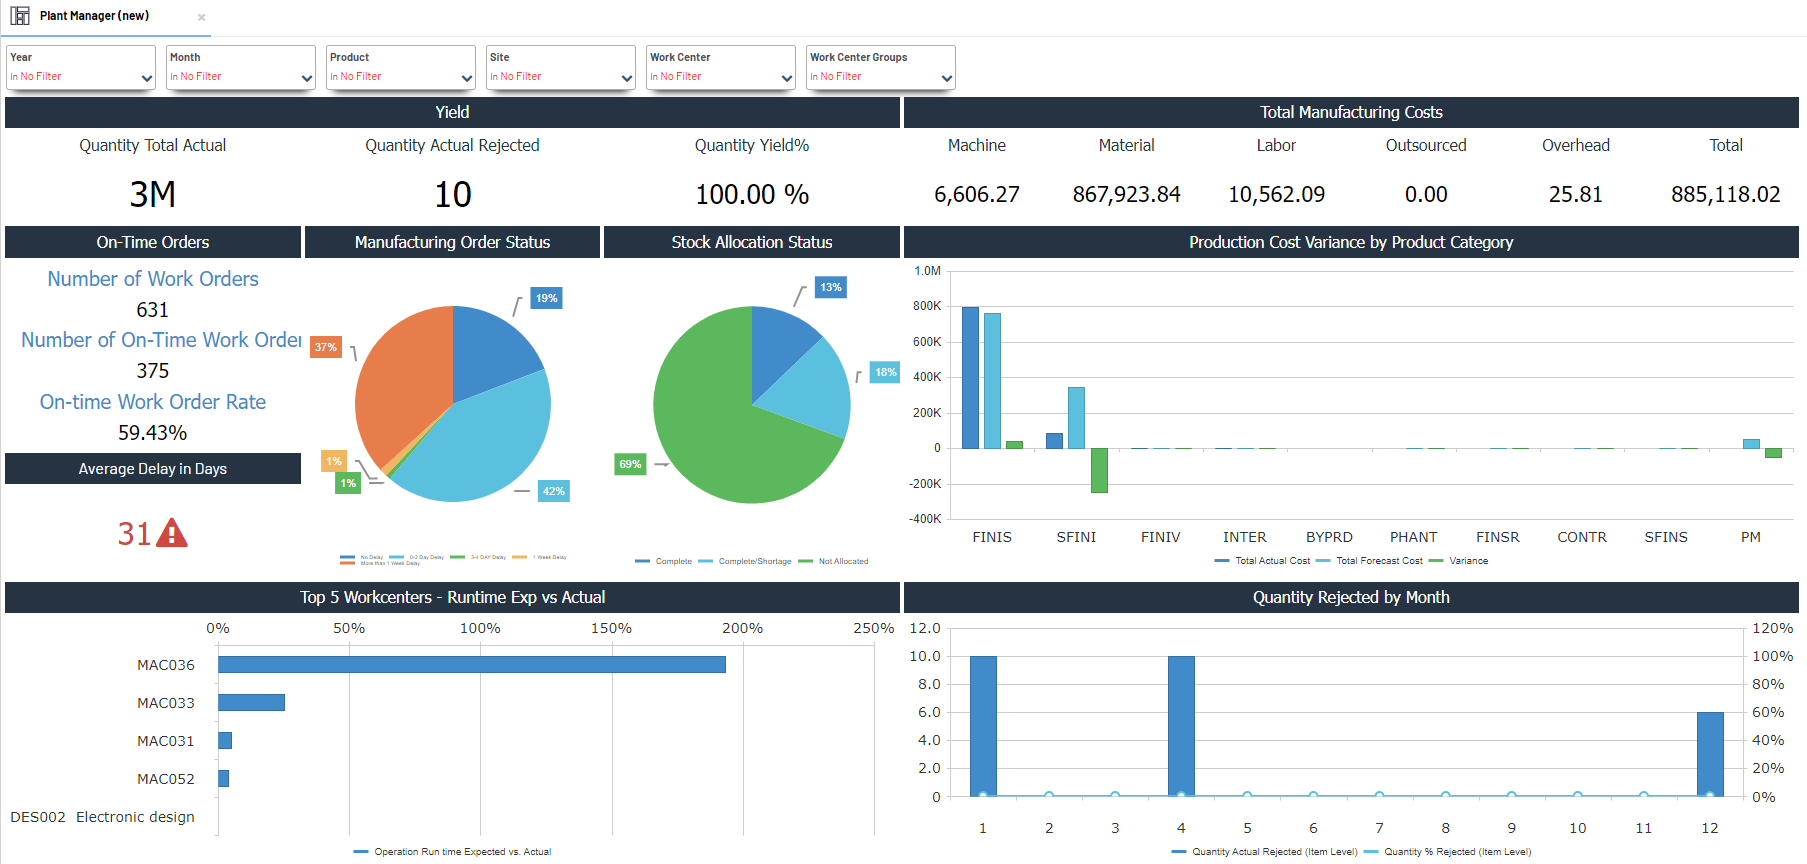
Key metrics at a glance:
-
Work Orders: This section tracks metrics such as the number of work orders, the number of off-line work orders, and the number of on-line work orders. These metrics help the plant manager understand how effectively the plant is meeting production schedules and identify any bottlenecks in the production process.
-
Yield: This section tracks metrics such as quantity total actual, quantity actual rejected, and quantity yield percent. These metrics help the plant manager understand how much product is being produced without defects.
-
Manufacturing Costs: This section tracks metrics such as machine cost, material cost, labor cost, and total manufacturing cost. These metrics help the plant manager understand the cost of production and identify areas for cost reduction.
-
Top 5 Workcenters Runtime Exp vs Actual: This section compares the expected runtime for the top 5 work centers with the actual runtime. This can help the plant manager identify areas where processes are taking longer than expected and investigate the reasons for the delays.
Benefits of this dashboard:
-
Improved visibility into production: The dashboard provides a central location to view real-time and historical data on production output, yield, and quality. This can help managers identify trends and potential problems early on.
-
Increased efficiency: The dashboard can help to identify areas where production processes can be improved
-
Better decision-making: By having all of the relevant data in one place, managers can make more informed decisions about Manufacturing processes.
Filtering
You can filter the dashboards using these filtering panels:
-
Year
-
Month
-
Product
-
Site
-
Work Center
-
Work Center Groups